Vertex and edge importance metrics are key tools in the analysis of networks. Most importance metrics are mainly vertex-based measures, rather than measures of edge properties. Forman-Ricci curvature and betweenness centrality are two examples of edge-based metrics that can be used in vertex centrality measures. However, quantum graph algorithms offer another possible edge-based metric for vertex centrality measure possibility through iterative maximum flow/minimum cut algorithms. Because of the nature of the quantum algorithm, a probabilistic scoring of these results is possible, giving confidence weightings to edge metrics found. In this paper, we propose an iterative quantum minimum cut/maximum flow algorithm to probabilistically rank edges with respect to flow importance, which can be used to derive importance scores for vertices connected to those ranked edges. This new metric is benchmarked against Forman-Ricci curvature and betweenness centrality for 3 small graphs to assess viability of the new metric. Each of these edge-based metrics yields somewhat different rankings of edges and vertices, suggesting that each is measuring a unique property of the graph. Proposed metric seems to struggle on highly-connected graphs, and more benchmarking is needed to explore viability on these type of graphs.
1. Introduction
1.1 Network Analysis Overview
Network analysis is ubiquitous in many fields of science today, and one of the most-studied areas of network analysis involves centrality rankings of vertices and edges of a given graph [1]. Vertex-based centrality metrics abound and have found success in many applications [1]. Some examples of vertex-based centrality metrics include hub centrality [2], eigenvector centrality [3], degree centrality [4], and cross-clique centrality [5]. Important applications of these have included super-spreader identification in epidemic models [6], assessment of network infrastructure [7] and vulnerability [8], and targeted disruption of terrorist communication networks [9].
Edge-based rankings are less common, and many focus on edges as a means to adjust vertex-based rankings (such as Katz centrality [9], PageRank centrality [10], or betweenness centrality [11]), rather than edge-based rankings as a goal [1]. However, recent studies suggest that metrics derived specifically to quantify edge importance can be useful tools and can provide additional information regarding network structure and can be used to derive vertex importance rankings that perform well in network disruption (such as the recently-developed Forman-Ricci curvature [12], [13]). Very few measures targeting edge properties currently exist, and new ways of measuring edge properties are likely to compliment existing metrics in network analysis. Benchmarking on a variety of graph structures can help establish new metrics as robust in network analysis or highlight their limitations on certain types of graphs, such as dense graphs.
Quantum computing offers several well-studied graph algorithms that can be adapted to derive edge importance metrics/rankings, including the minimum cut/maximum flow algorithm [14], [15]. Application of this algorithm on a given graph yields rankings of edges in terms of cut likelihood; cut likelihood reflects importance to flow disruption. Given the probabilistic nature of quantum graph analysis algorithms, a distribution of solutions at each step is given by the algorithm. Thus, edge 1 may be the most likely edge solution with a probability of 0.7, while edge 7 may be the least likely edge solution with a probability of 0.05. Vertex importance can then be derived by summing edge probabilities for edges connected to a given vertex, similar to how Forman-Ricci curvature is used to derive vertex importance scores. Minimum cut/maximum flow algorithms have been related to vertex and edge centrality previously, but no applications regarding quantum minimum cut/maximum flow approaches seem to exist. It is unknown how this type of algorithm might perform across types of network problems or how this metric might relate to Forman-Ricci curvature or other successful edge-based ranking metrics.
1.2 Contribution
This paper presents a novel edge importance scoring and subsequent derivation of vertex importance scoring based on a quantum minimum cut/maximum flow algorithm, which provides probabilistic solutions to the minimum cut/maximum flow problem. This yields a potentially useful edge-based centrality metric, which is explored in 3 small example graphs and compared with Forman-Ricci curvature edge and vertex rankings and betweenness centrality vertex ranking. Results suggest each edge-based metric yields different insight into the structure of the graph, and quantum minimum cut/maximum flow metrics provide another tool for network analysis.
This paper provides a case study on benchmarking quantum network analysis tools, as well as introducing the new network analytics tool, such that other quantum network analysis tools can be developed and benchmarked effectively.
2. Methods
2.1 Overview of Forman-Ricci Curvature Centrality
One new tool that has been well-explored in the past few years is Forman-Ricci curvature, a discrete version of a central tool in differential geometry, Ricci curvature [12], [13]. Technically, Ricci curvature measures deviation from a standard sphere in Euclidean space, such that curvature on the manifold squishes, pulls, or compresses parts of the sphere [12]. This measures the distortion of Euclidean space at a given point on the manifold [12].
Forman derived a discrete version of Ricci curvature that could be applied to meshes, graphs, and other discrete geometric objects based on edge connectivity through vertices connected by that edge. For an unweighted graph, the formula for Forman-Ricci curvature simplifies to:
where vertex 1 and 2 are the vertices connected by the edge of interest. In figure 1 below, consider edge A, which connects vertices 2 and 3. A parallel edge would connect to either vertex 2 (such as edge B) or vertex 3 (none in this example). Thus, the Forman-Ricci curvature for edge A would be -1, where the Ricci curvature is calculated as 2-1-2= -1.
Fig. 1. Example graph used to explain parallel edges in the Forman-Ricci curvature formula for unweighted graphs.
To derive vertex-based metrics from the edge values, one can sum the Forman-Ricci curvature values for each edge connected to a given vertex. In figure 1, edges A and B both have Forman-Ricci curvature of -1, , in which the sum of the Forman-Ricci curvature value for edges connected to vertex 2 is -2.
2.2 Overview of Betweenness Centrality
Betweenness centrality relies on number of shortest paths between vertices in the network, such that edges and vertices involved in a large fraction of shortest paths present in the network will rank high in betweenness centrality [11]. In figure 1, vertex 2 would rank high in betweenness centrality, as it is involved in shortest paths between vertices 1 and 2, 2 and 3, and 1 and 3. Vertices 1 and 3 are only involved in 2 shortest paths. Were there an edge C connecting vertices 1 and 3, all vertices would have an equal ranking.
Technically, betweenness centrality is defined as:
Betweenness centrality= (2)
where s and t are arbitrary vertices in the graph, v is the vertex of interest with respect to number of shortest paths through vertex v, (v) is the number of shortest paths through vertex v, and is the total number of shortest paths [11].
2.3 Overview of Proposed Quantum Maximum Flow/Minimum Cut Centrality
The maximum flow/minimum cut problem has a dual solution using quantum approximate optimization algorithm solutions in Rigetti’s pyquil language, specifically the pyQAOA package’s max_cut function (dual of minimum cut) with Nelder-Mead optimization and maximum steps of 5, 10, and 15, so as to be able to understand convergence properties on the 3 graphs. Convergence was defined as a solution with >67% probability of optimality.
One of the main advantages of using a quantum approach to this problem is the probabilistic nature of the solutions, such that all solutions are considered and can be ranked according to probability of optimality of a given solution. Thus, one can rank the cuts and, by extension, the links being cut by the solutions. This gives a weighting of edges, from which importance scores can be derived.
Edges were first ranked by converged solutions, including all solutions with >10% probability of solution optimality. Edge weights were assigned according to the sum of cut probabilities in solutions included in the converged solution. To obtain vertex importance scores, edge weights of edges connected to a given vertex were summed together, creating a final importance score for each vertex.
2.4 Overview of 3 Example Graphs and Ranking Comparison Methodology
This study focused on 3 graphs that were generated to illustrate the differences in these edge-based centrality metrics with simple graph structures that can be visualized to understand results (figure 2); these graphs vary density of graphs to explore functioning on both sparse and dense graphs. Vertex importance scores compared include Forman-Ricci curvature centrality, betweenness centrality, and quantum minimum cut/maximum flow centrality. Edge scores compared include Forman-Ricci curvature and quantum minimum cut/maximum flow centrality.
Fig. 2. Graphs used for the comparison of edge-based centrality metrics.
3. Results
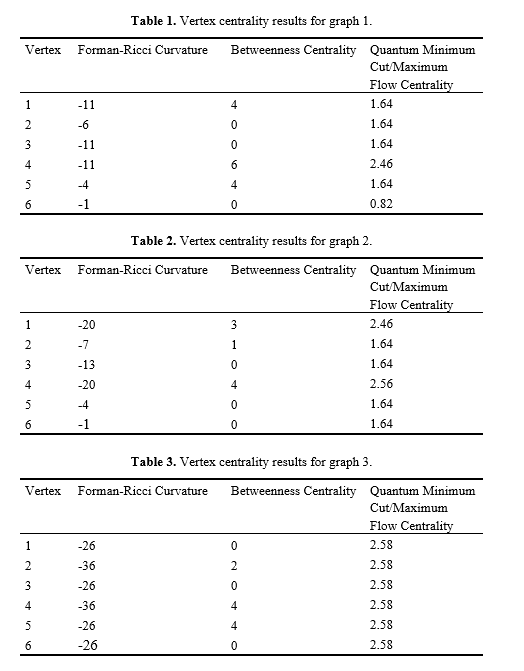
3.1 Vertex Centrality Results
Results suggest that each type of vertex centrality yields slightly different rankings of vertex importance for the example graphs. However, there is some correspondence between different scores that suggests a relationship between Forman-Ricci curvature and betweenness centrality (correlation= -0.41 for graph 1), which has been found in previous papers [17]. Correlations of these different centralities scores with our proposed metric are -0.71 (Forman-Ricci curvature) and 0.71 (betweenness centrality), respectively for graph 1. These correlations are even stronger for graph 2: -0.88 (Forman-Ricci curvature and proposed metric), 0.96 (betweenness centrality and proposed metric), -0.79 (Forman-Ricci curvature and betweenness centrality). Given a standard deviation of 0 in graph 3’s proposed metric results, correlations could not be obtained for comparison; however, a correlation of -0.52 is obtained for the comparison of Forman-Ricci curvature and betweenness centrality. While there is substantial correlation, results suggest that our proposed metric yields different information about vertex and edge importance to graph structure.
These results suggest that more work is needed to explore the efficacy of the new metric on dense graphs, as no variation in metric was noted for the new metric. By benchmarking on several types of graph structures, one is able to find potential pitfalls in new quantum algorithms and set the priority to understand these potential limitations.
3.2 Edge Metric Results
Edge metric results suggest that all three graphs have a hyperbolic geometry according to their generally negative Forman-Ricci curvature and confirm prior results of a moderate inverse relationship between Forman-Ricci curvature and betweenness centrality.
When considering edge importance in our proposed metric, most cut solutions yield many cuts in these 3 example graphs, giving most edges a high-probability cut value. Convergence to a solution took 10 steps for graphs 1 and 2; graph 3 required 15 steps for convergence. Below these values, probability was spread among many solutions, such that solutions were not informative about graph structure.
More work is needed to explore the new metric on dense graphs, such as graph 3. Results aren’t sensitive enough to distinguish between edge or vertex importance, and convergence is slow. By comparing with several state-of-the-art classical methods across a variety of graph structures, it is possible to uncover potential problems with the quantum algorithm and how it compares to established network metrics.
4. Conclusions
This paper presents a novel edge-based importance ranking of vertices and edges based on a quantum max flow/min cut algorithm, where cut probability at convergence is taken to be edge importance scoring. The proposed algorithm correlates well with extant edge-based important metrics, such as Forman-Ricci curvature and betweenness centrality. This suggests that the proposed importance ranking algorithm captures some underlying properties of the edges that are common among edge-based ranking metrics while providing additional information not captured by these extant edge-based ranking metrics. In addition, the limitations on this metric’s use for dense graphs have been revealed, suggesting possible extensions of this benchmarking on larger dense graphs. This study also introduces a graph-based quantum algorithm and its benchmarking as a case study to a wider audience of network scientists, who may not be familiar with the tools of quantum computing or the methods needed to benchmark them.
References
[1] White, S., & Smyth, P. (2003, August). Algorithms for estimating relative importance in networks. In Proceedings of the ninth ACM SIGKDD international conference on Knowledge discovery and data mining (pp. 266-275).
[2] León, C. (2013). Authority centrality and hub centrality as metrics of systemic importance of financial market infrastructures.
[3] Bonacich, P. (2007). Some unique properties of eigenvector centrality. Social networks, 29(4), 555-564.
[4] Opsahl, T., Agneessens, F., & Skvoretz, J. (2010). Node centrality in weighted networks: Generalizing degree and shortest paths. Social networks, 32(3), 245-251.
[5] Everett, M. G., & Borgatti, S. P. (1998). Analyzing clique overlap. Connections, 21(1), 49-61.
[6] Fu, Y. H., Huang, C. Y., & Sun, C. T. (2015). Identifying super-spreader nodes in complex networks. Mathematical Problems in Engineering, 2015.
[7] Hines, P., & Blumsack, S. (2008, January). A centrality measure for electrical networks. In Hawaii International Conference on System Sciences, Proceedings of the 41st Annual (pp. 185-185). IEEE.
[8] Krebs, V. (2002). Uncloaking terrorist networks. First Monday, 7(4).
[9] Zhao, J., Yang, T. H., Huang, Y., & Holme, P. (2011). Ranking candidate disease genes from gene expression and protein interaction: a Katz-centrality based approach. PloS one, 6(9), e24306.
[10] Halu, A., Mondragón, R. J., Panzarasa, P., & Bianconi, G. (2013). Multiplex pagerank. PloS one, 8(10), e78293.
[11] Brandes, U. (2001). A faster algorithm for betweenness centrality. Journal of mathematical sociology, 25(2), 163-177.
[12] Weber, M., Saucan, E., & Jost, J. (2017). Characterizing complex networks with Forman-Ricci curvature and associated geometric flows. Journal of Complex Networks, 5(4), 527-550.
[13] Sreejith, R. P., Mohanraj, K., Jost, J., Saucan, E., & Samal, A. (2016). Forman curvature for complex networks. Journal of Statistical Mechanics: Theory and Experiment, 2016(6), 063206.
[14] Cui, S. X., Freedman, M. H., Sattath, O., Stong, R., & Minton, G. (2016). Quantum max-flow/min-cut. Journal of Mathematical Physics, 57(6), 062206.
[15] Hastings, M. B. (2017). The asymptotics of quantum max-flow min-cut. Communications in Mathematical Physics, 351(1), 387-418.
[16] Farhi, E., & Harrow, A. W. (2016). Quantum supremacy through the quantum approximate optimization algorithm. arXiv preprint arXiv:1602.07674.
[17] Sreejith, R. P., Jost, J., Saucan, E., & Samal, A. (2017). Systematic evaluation of a new combinatorial curvature for complex networks. Chaos, Solitons & Fractals, 101, 50-67.
Miss Colleen M. Farrelly is a machine learning researcher and data scientist whose industry experience spans healthcare, military logistics, biotech, finance, and education. Her research focuses mainly on classical and quantum algorithms in topological data analysis, manifold learning, and graph theory.
Benutzergenerierte Software (UGS) markiert die nächste Stufe der KI-gestützten digitalen Kreation. Da „Vibe Coding“ natürliche Sprache in ausführbare Anwendungen umwandelt, können Nutzer Tools, Dashboards,
Die Digitalisierung erhöht den Druck auf öffentliche und gemeinwohlorientierte Organisationen, ihre IT-Sicherheit grundlegend neu zu denken. Am Beispiel des Kita-Trägers Katholino des Erzbistums Köln
Dieser Beitrag dokumentiert 179 Halluzinationen im produktiven Betrieb eines KI-Kommunikationssystems für KMU. Es werden fünf Kategorien identifiziert und eine vierstufige Schutzarchitektur vorgestellt. Die Ergebnisse


Um einen Kommentar zu hinterlassen müssen sie Autor sein, oder mit Ihrem LinkedIn Account eingeloggt sein.