1 Introduction
With quantum mechanics limiting further minimization of transistors at some point, Moore’s law is facing its end [28]. However, the same rules of quantum mechanics offer a new path for information processing, where information is stored in quantum states and computations can be performed in parallel [4]. Although several algorithms are considered to outperform classical computing, such as Grover’s famous search or Shor’s factoring algorithm [21], large and fault-tolerant quantum computers will probably not be realized within near future due to technological challenges. Instead, small quantum computers with few and imperfect qubits will dominate on near-term, so called noisy intermediate-scale quantum (NISQ) devices [13], which are already commercially available. One of the promising candidates to show a quantum advantage on such devices is believed to be quantum machine learning (QML) [12,20]. Machine learning (ML) has become an important tool to process data and extract information from them in a great variety of applications. Facing a steadily increasing amount of data and limiting processor capacity, developing more efficient algorithms seems crucial and using quantum computers seems to be a promising approach. In this work we build on the variational quantum circuit proposed by Farhi and Neven [3], that has a similar structure as a feed-forward neural network, on a cloud-based quantum simulator. We present the explicit circuit representation and apply the circuit to a dataset. Next, we propose a more compact presentation of input data than in the original proposal. The limited availability of qubits will ask for a efficient way to store input data in the near future. The remainder of this work is as follows. In Section 2 we give an introduction to classical machine learning to introduce the concept and some terminology. In Section 3 our contribution will be elaborated. Next, in Section 4 results of the learning and the dense representation are presented.
2 Machine learning
ML algorithms are traditionally divided into three classes: supervised, unsupervised and reinforced learning. In supervised learning, a training-set (mathcal{T}=left{mathbf{x}_{p}, mathbf{c}_{p}right}_{p=0, dots, N-1})is presented to the algorithm, containing N feature vectors xp and their correct classifications cp. Such inputs are called labeled data, where labeling is the process of assigning task-specific tags to each input. The algorithm then optimizes the overlap of its outputs (left{mathbf{y}_{p}right}) with the desired ones by varying internal parameters. New unlabeled inputs are classified without further optimization. This type of learning is mainly used for pattern recognition. A very popular instance of machine learning is inspired by neurons in nature. Such artificial neural networks (ANN) consist of nodes called neurons and edges connecting the neurons like synapses. To create a network, neurons and edges are connected in various configurations, which do not change in time. The way in which nodes are connected strongly depends on the model that is used. ANNs are often considered as layered, which means that the state of the i-th neuron in the n-th layer is described by (text { by } x_{i}^{(n)} in{pm 1}). For this type only nodes of adjacent layers are connected, whereas there are no synapses within one layer. Of course, more general configurations may
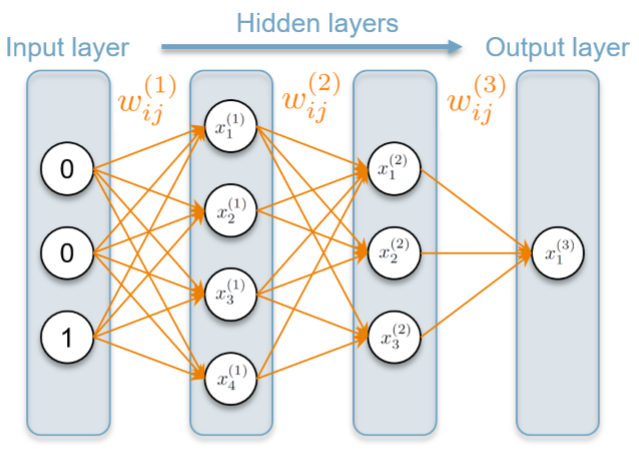
be considered, yet we restrict ourselves to layered networks here. The edges connecting layers n−1 and n are associated with weights (w_{i j}^{(n)} in[-1,1]) corresponding to the synaptic strength of two nodes. In general, these weights can have different values for both directions. However, usually only bidirectional or directed edges are considered, where either ((w_{i j}^{(n)}) is symmetric or the weight for one of both directions is zero. The weights between layers n−1 and n can be summarized in a weighting matrix (W^{(n)}). In feed-forward ANNs, all edges are directional, such that signals are heading only for one direction. The input and output neurons can be directly observed from the outside, which is why they are regarded as visible. Contrary, neurons in intermediate layers are referred to as hidden or latent, as they belong to the model and do not interact with the outside. An example of a layered ANN with two input neurons, two hidden layers of four and three neurons and a binary output layer is shown in Fig. 1. The evolution of a network is determined by the input states and its weights. For the activation of a single neuron, the pre-synaptic states of all connected nodes are added up by a weighted sum, which is regarded as post-synaptic signal. An activation function f is then applied to the post-synaptic signal to determine the state of this neuron (x_{i}^{(n)}) according to
$$
x_{i}^{(n)}=fleft(sum_{j=1}^{N} w_{i j}^{(n)} x_{j}^{(n-1)}right)
$$ (1)
It can be shown that an ANN with several layers and linear activation function is equivalent to a different ANN with only input and output layer [15]. Thus, typically nonlinear f are chosen. In the case of McCulloch-Pitts neurons the activation follows an integrate-and-fire scheme, where a neuron is firing if the incoming post-synaptic signal exceeds its activation threshold (t_{i}^{(n)}) i and resting else. Here, f is a step-function with a threshold (t_{i}^{(n)}) i and the activation follows
$$
x_{i}^{(n)}=left{begin{array}{cl}
{1,} & {sum_{j=1}^{N} w_{i j}^{(n)} x_{j}^{(n-1)} >=t_{i}^{(n)}} \
{-1,} & {text { else }}
end{array}right.
$$ (2)
Since the step function is not injective, from knowing the states of one layer it is not possible to retrieve those of the previous layer, so in some sense information is lost. However, this dissipative behavior is exactly the desired aim in practice, as only crucial information should be extracted from large amounts of data.
To train an ANN in supervised fashion from a training set, its weights are optimized to minimize a loss function averaged on all samples. The loss (loss(mathbf{y}, mathbf{c})) is a measure of the distance of the predicted result (mathbf{y}_{boldsymbol{p}}) and the actual label cp. In more general terms, a function f ∈F from a family F = {fθ(x)}θ parametrized by parameters θ should be found that minimizes
$$
E_{N}left(f_{theta}right)=frac{1}{N} sum_{p=0}^{N-1} lossleft(f_{theta}(x), mathbf{c}right)
$$ (3)
where (E_{N}left(f_{theta}right)) is called empirical risk [1]. The parameters θ correspond to the weights introduced before. One algorithm for this optimization is gradient descent, meaning that the parameters are updated by a term linear in the gradient of Eq. (3) with respect to θ. For this, the loss function must be evaluated for the whole training set for a single update, which may cause problems in the quantum setting as we will discuss later. Stochastic gradient descent, however, requires only the estimation of the gradient of loss for single sample for one update. Here, a sample and its label (left(mathbf{x}_{p}, mathbf{c}_{p}right)) is chosen uniformly at random from T and the parameters are updated according to
$$
theta_{i+1}=theta_{i}-r nabla_{theta} loss(mathbf{y}, mathbf{c})
$$ (4)
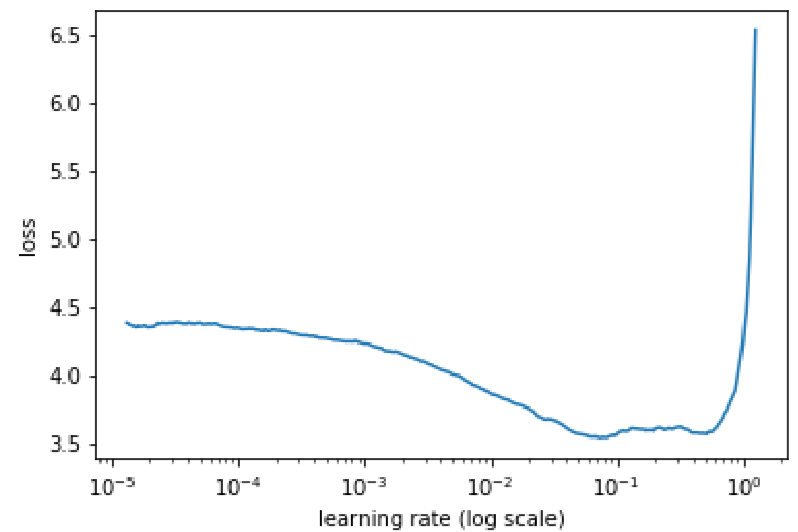
Here, the learning rate r is introduced, which plays an important role in most ML algorithms as hyper-parameter. Tuning hyper-parameters of a model is considered almost as important as the choice of a model itself [10]. If r is too large, the steps in parameter space may be too large and result in a chaotic behavior. Contrary, a too small r may drastically increase the number of iterations to reach a minimum. Typically, r ranges from (10^{-6}) to 1 and may be different for any model or dataset. A well established strategy is to slowly decrease the learning rate throughout the training, for which it is essential to start with a good initial r. Another method is to cyclically vary the learning rate between reasonable bounds that must be determined as well, which shows benefits in performance for many architectures [22]. A proposed method to find a good starting r is to start with a small learning rate and increase it during a test run of training exponentially or linearly. Fig. 2 as taken from Ref. [25] exemplarily shows how the loss may evolve. The sweet spot for an initial r is where the loss decreases most. This should be taken as a rule of thumb to find the order of r, meaning that a precise analysis is not required.
3 A hybrid quantum neural network approach
A recently very popular approach to find and implement new hybrid QML algorithms, especially in the context of QNNs [27], consists of circuits with a number of gate parameters that are optimized. These so called variational quantum circuits can be used to evaluate some cost function, which is a measure of the performance of the model on certain input data. To optimize the cost function a variety of classical strategies can be used, which in turn may again employ a quantum circuit. Typically, the composition of variational quantum circuits is based on trial and error or a physically motivated ansatz [2,18] . This also shows that a theoretical framework is hardly established yet. Recent examples of variational quantum circuits aiming for near-term viability are proposed for instance in Refs. [3,16,17,9,19] . Yet, the majority of proposed quantum algorithms rely on simulations of quantum computers, however there have already been a few actual realizations on real devices as in Refs. [6,11,29] .
In Ref. [3] Farhi and Neven propose a quantum version of a feed-forward neural network for binary classification, consisting of a variational quantum circuit with a sequence of unitary gate operations depending on continuous variables. Classical input bits are directly translated to the corresponding qubit states and a single-qubit read-out at the end decides on the classification. We present their framework in more detail in Sec. 3.1. They show that their model can represent any Boolean label function, although such a representation may not necessarily be efficient in terms of quantum gates used. As a proof of concept the proposed QNN is applied to real-world data in simulations, consisting of down-sampled 4×4 images originating from the MNIST dataset of handwritten numbers. Without any optimization, a classical NN easily classifies this dataset with an error rate of 1%, where training and test set are not disjunct. In their simulations the authors find a comparable categorical error rate of 2% for the quantum circuit after seeing less than the whole dataset, which consists of 6031 samples. Moreover, the same data are presented as batches in uniform superpositions of all samples belonging to a label. Here, the empirical risk settles to a value of around 0.5, where 0 corresponds to perfect classification and 1 is random guessing. Overall, their proposed model of a supervised quantum machine learning algorithm seems promising for implementation on actual quantum devices in the near future.
Inspired by the work of Farhi and Neven in Ref. [3], we follow their framework and aim for a more compact representation of input data. Unlike in the original work, we present an explicit decomposition of the formalism into single-qubit rotations and CNOTs, which form a universal gate set. Also, in our work we use a different scheme for gradient estimation. Our circuits for training are presented in Sec. 3.2 and can directly be applied to actual quantum devices. Finally, we will present way to construct a dense presentation of the data in Section 3.3.
3.1 Theoretical framework
As proposed by Farhi and Neven, a classical binary input patterns of length n represented by an integer z ∈ (left{0, ldots, 2^{n-1}right}) is translated to the initial state (|z, 1rangle=left|z_{1}, z_{2}, ldots, z_{n}, 1rightrangle) of a quantum register with n + 1 qubits. We will regard the first n qubits as input register. The last qubit is eventually the readout qubit we measure in the Y -basis to estimate the classification of a sample. Between initialization and readout a set of L unitaries (left{U_{k}left(theta_{k}right)right}) act on the register, where each unitary has the form
$$
U_{k}(theta)=e^{i theta_{k} Sigma_{k}}
$$ (5)
Here, (Sigma_{k}=sigma_{1}^{j_{1}} otimes cdots otimes sigma_{n+1}^{j_{n+1}}) are generalized Pauli operators with jk ∈{0,1,2,3} and (theta_{k} in[0,2 pi]). We call this the classification circuit. To simplify notation, we summarize the applied unitaries as
$$
U(boldsymbol{theta})=U_{L}left(theta_{L}right) ldots U_{1}left(theta_{1}right)
$$ (6)
The unitaries act on the register sequentially as shown in Fig. ?? for L = 3, which appears similar to a neural network with L layers with each the same number of neurons. In this picture, the unitary operations play a similar role as weights in feed-forward neural networks. The state of the quantum register between two adjacent unitaries then corresponds to the states of neurons in the classical sense. Note, however, that the analogy to a feed-forward neural network is not perfect. In the quantum case there is no dissipation, since all operations are unitary. In the classical case, this may be interpreted as linear activation functions and neurons that take continuous values. Moreover, quantum mechanics allows for superpositions of computational basis states, whereas classical neurons are deterministic. The expected value of the final Y -measurement is given by (leftlangle z, 1left|U^{dagger}(boldsymbol{theta}) Y_{n+1} U(boldsymbol{theta})right| z, 1rightrangle). From this, a cost or loss function loss can be introduced as
$$
loss(boldsymbol{theta}, z)=1-l(z)leftlangle z, 1left|U^{dagger}(boldsymbol{theta}) Y_{n+1} U(boldsymbol{theta})right| z, 1rightrangle
$$ (7)
where l(z) ∈±1 is the correct label of an input z. The second term is called margin and the loss can take values between 0 and 2. Note that all unitaries are periodic functions with the usual period (2 pi). Obviously, if the expected value yields the same value as the label, the loss vanishes and takes its maximum, if always the opposite label is measured. A loss of 1 then corresponds to randomly guessing the classification with equal probability of outcomes. Thus, the loss is an expression for how close the circuit’s classification is to the actual label. The aim of training is to minimize the loss. Therefore, consider the loss after updating the parameters (boldsymbol{theta} text { by } gamma mathbf{g}) with gradient (g = ∇θloss(θ,z)). Tayloring the new loss to the first order of (gamma) yields
$$
loss(boldsymbol{theta}+gamma mathbf{g}, z)=loss(theta, z)+gamma mathbf{g}^{2}+mathcal{O}left(gamma^{2}right)
$$ (8)
The equation could directly be set to zero and solved for (gamma) , which drives the loss for this sample towards 0. However, such a strategy may be disadvantageous for other samples. As a typical machine learning strategy, a learning rate r is introduced then. The final updating strategy can then be written as
$$
boldsymbol{theta}_{i+1}=boldsymbol{theta}_{mathbf{i}}-rleft(frac{lossleft(boldsymbol{theta}_{mathbf{i}}, zright)}{mathbf{g}^{2}}right) mathbf{g}
$$ (9)
which is corresponds to the usual update rule of stochastic gradient descent in Eq. (4) up to the factor in brackets. This factor offers the advantage of adaptivity: gradients with a small norm are rendered more important than in Eq. (4) and the influence of gradients with larger norms is decreased. In this way the updating process is more stable than the non-adaptive variant. As all unitaries are of the form (6), the partial derivative of the loss with respect to a parameter (theta_{k}) can be computed as
$$
begin{aligned}
frac{partial operatorname{loss}(boldsymbol{theta}, z)}{partial theta_{k}}=&-frac{partial}{partial theta_{k}} l(z)leftlangle z, 1left|U_{1}^{dagger} ldots U_{L}^{dagger} Y_{n+1} U_{L} ldots U_{1}right| z, 1rightrangle \
=&+ i l(z)leftlangle z, 1left|U_{1}^{dagger} ldots Sigma_{k}^{dagger} U_{k}^{dagger} cdots U_{L}^{dagger} Y_{n+1} U_{L} ldots U_{1}right| z, 1rightrangle \
&- i l(z)left(leftlangle z, 1left|U_{1}^{dagger} cdots Sigma_{k}^{dagger} U_{k}^{dagger} cdots U_{L}^{dagger} Y_{n+1} U_{L}left(theta_{L}right) ldots U_{1}left(theta_{1}right)right| z, 1rightrangleright)^{*} \
=& 2 l(z) operatorname{Im}left[leftlangle z, 1left|U_{1}^{dagger} cdots U_{L}^{dagger} Y_{n+1} U_{L} ldots Sigma_{k} U_{k} ldots U_{1}right| z, 1rightrangleright.
end{aligned}
$$ (10)

For clarity we skipped the dependence on parameters here. To estimate the last expression, we follow the more general scheme presented by Romero et al. in Ref. [16]. A scheme as displayed schematically in Fig. 3 can be used to estimate the imaginary part of the expression in Eq. 10. Here, the previous classification circuit with an input state |z,1i is extended by an ancilla qubit and two controlled operations. The ancilla qubit is initialized to (|0rangle) and a Hadamard gate maps it to (1+)). After the k-th unitary, (Sigma_{k}) is applied to the register controlled by the ancilla. Rather than performing a Y -measurement on the n + 1-th qubit as before, a controlled Y gate is applied. Eventually, the ancilla qubit is measured in the Y -basis. The probability to measure (|+irangle) can be related to the imaginary part of the expression of Eq. 10 via
$$
operatorname{Pr}_{Y}[+i]=frac{1}{2}left(1+operatorname{Im}left[leftlangle z, 1left|U_{1}^{dagger} ldots U_{L}^{dagger} Y_{n+1} U_{L} ldots Sigma_{k} U_{k} ldots U_{1}right| z, 1rightrangleright]right)
$$ (11)
Combining Eq. (10) and (11), the partial derivatives of the gradient can be written as
$$
frac{partial operatorname{loss}}{partial theta_{k}}=2left(2 operatorname{Pr}_{Y}[+i]-1right)
$$ (12)
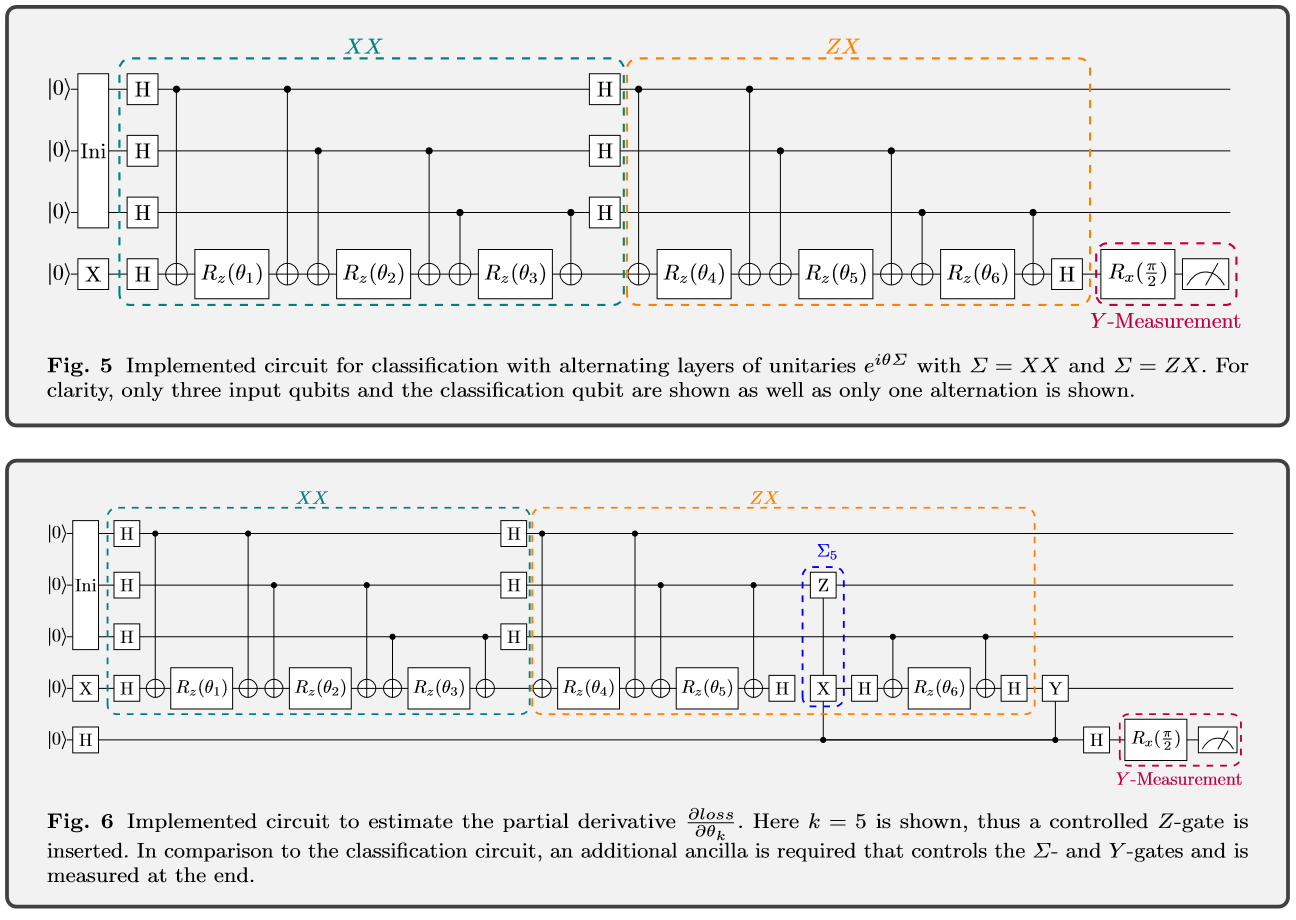
Summarizing, we can estimate the classification and eventually the loss of a sample with a quantum register of n + 1 qubits and apply L unitaries. To estimate the gradient, another ancilla qubit is required and in total L + 2 unitaries are applied to the original register, where the additional two are controlled by the ancilla. Note that all operators in the expected value of Eq. (10) are unitary, so the norm of the expected value is bounded by 1. Thus, the norm of the partial derivative is bounded by 2, which means the norm of the whole gradient is bounded by 2L. Therefore, the advantage of our strategy is that the gradient cannot blow up as in other ML algorithms. We now have all tools to train our network. Initially, all parameters are randomly initialized. In each iteration a sample is drawn from the training set and the quantum register is initialized accordingly with a trivial translation from a binary string to a computational basis state. Applying the classification circuit, the loss can be estimated by a Y -measurement via Eq. (7). Using another ancilla qubit, the gradient is being estimated and the parameters are updated according to Eq. (9). In Ref. [3] the authors test sequences of randomly chosen Σ, which is an common ansatz for variational quantum circuits in recent research. After some testing, they found that sequences of Pauli-operators of the type (X_{k} otimes X_{n-1}) and (Z_{k} otimes X_{n-1}) performed best. The last operator each acts on the read-out qubit, the first on any of the others. This choice can be physically motivated: Depending on the state of a qubit of the input register, the readout qubit is rotated in different directions by a certain amount. Gates of the form (Z_{k} otimes X_{n-1}) thus rotate the last qubit by θk in mathematically positive direction if the corresponding input qubit is in state (|0rangle) and in the opposite direction if (|1rangle) is realized. Since quantum mechanics allows for superpositions of basis states, of course, in general both rotations are performed with a certain probability. In this sense, the choice of gates seem reasonable, as (Z_{k} otimes X_{n-1}) considers the two computational basis states and (X_{k} otimes X_{n-1}) the relative phase between both. However, it is worth mentioning that this is an explanation why such a combination of gates seems reasonable, but it is not necessarily the best one could find. The proposed structure is to first apply the X ⊗X unitary to each input and the output qubit and then the same again for the latter unitary. We regard to this sequence as one alteration of first a XX-layer and then a ZX-layer. We will choose the number of alternations depending on the dataset.
3.2 Quantum circuits for training
The circuits discussed in the previous chapter are rather theoretical yet. For a simulation this may be enough, however we aim for a framework that could directly be implemented on a real quantum device. Thus, we decompose each unitary as in Eq. (6) in a single-qubit rotations and two CNOTs, which together form a universal gate set. The unitaries can be implemented with the circuits shown in Fig. 4. Using this implementation, the classification circuit can be realized as shown in Fig 5. For reasons of clarity only one alternation is applied and the classical bit strings have a size n = 3. At the end, the readout qubit is measured in the Y -basis, which corresponds to a (frac{pi}{2}) -rotation around X followed by a measurement in the computational basis. For an input bit sting of length n this implementation requires n+1 qubits and (4 * n * N_{mathrm{A}}) CNOT-gates, where (N_{mathrm{A}}) is the number of alternations. The circuit used to estimate the partial derivatives (frac{partial log s}{partial theta_{k}}) is presented in Fig. 6. For clarity, a smaller version with only three input qubits is shown. In comparison to the classification circuit, another ancilla qubit and three more CNOT-gates are required. In the given illustration k = 5, since this unitary is in a ZX-block a controlled Z-gate is applied.
3.3 Dense presentation of data
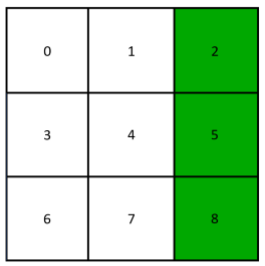
In the original work by Farhi and Neven, classical input data are trivially translated to a quantum register, so a bit string is mapped to the corresponding computational basis state. Now we discuss a more compact presentation of data, still assuming that the inputs are binary bit strings of length N. Say √N is an integer, then we can visualize the bits as quadratic pixel images with binary values. Note that this is used rather for visualization and is no restriction. An example image corresponding to a bit string (0,0,1,0,0,1,0,0,1) is shown in Fig. 7, where the white fields are assigned with 0 and the green with 1. The bits are numbered from 0 to N −1. The idea of our dense representation of data is to map the bit string to a superposition of computational basis states of a register with (n=leftlceillog _{2} Nrightrceil). A possible mapping is initialize the positions of green pixels in superposition, which in the case of our example is (frac{1}{sqrt{3}}(|2rangle+|5rangle+|8rangle)). Of course, the other way round by presenting the positions of white fields in superposition works just as fine. Obviously, the scheme can only be applied, if the dataset does not contain samples with only white or only green fields, respectively. If this condition is fulfilled, the size of qubits required to represent the data is logarithmic in the input size, which offers a big advantage over the trivial presentation of data. Especially on NISQ devices with limited number of logical qubits such a scheme is preferable.
What remains is to actually implement quantum circuits that prepare such superpositions. In fact, initializing a superposition is not as trivial as it may seem. Several approaches have been proposed to perform such an encoding of data into amplitudes of a quantum register efficiently, as for example in Refs. [26,23] . However, in both references ancilla qubits are required. Thus we follow a scheme proposed by Long and Sun in Ref. [8], which is claimed to initialize a register in a normalized superposition of basis states
$$
|psirangle=sum_{i=0}^{N-1} a_{i}|irangle, quad a_{i} in mathbb{C}
$$ (13)

without need for ancillary qubits. Their algorithm consists of N −1 single-qubit rotations, which may be controlled by k other qubits. The angles of the rotation depend on the parameters (boldsymbol{a}_{boldsymbol{i}}) via the general formula
$$
alpha_{j ; i_{1} i_{2} ldots i_{j-1}}=arctan sqrt{frac{sum_{i_{j+1} ldots i_{n}}left|a_{i_{1} i_{2} ldots i_{j-1} 1 i_{j+1} ldots i_{n}}right|^{2}}{sum_{i_{j+1} ldots i_{n}}left|a_{i_{1} i_{2} ldots i_{j-1} 0 i_{j+1} ldots i_{n}}right|^{2}}}
$$ (14)
Here, the index j ∈{1,…,n} is the target qubit and the rotation is only executed if the j−1 previous qubits are in state (left|i_{1}, i_{2} dots, i_{j-1}rightrangle ). Thus, there are (2^{j-1}) multi-controlled rotations acting on the j-th qubit, although they may be trivial depending on the coefficients (boldsymbol{a}_{boldsymbol{i}}). Typically when an operation is controlled by k other qubits, it means that the operation is only applied if all k qubits are in state (|1rangle). Conditioning an operation on other constellations can be achieved by inserting X gates before and after the conventional multi-controlled operation. An example of such a circuit is shown in Fig. 8, where the superposition (|psirangle=frac{1}{sqrt{3}}(|2rangle+|5rangle+|8rangle)) is prepared. Indeed, most of the rotations are trivial and can be discarded. Note that the denominator in Eq. (14) may vanish, in this case a closer analysis is required. We implemented the six circuits required to initialize all samples from the bars and stripes dataset. Figure 8 shows the circuit to initialize a stripe on the right. However, it turns out that the scheme presented before is not the whole story. In fact, multi-controlled gates actually require ancillary qubits as well. Although the goal was to avoid using more qubits, we implicitly need ancillas though. Thus, the scheme we chose may not be the most efficient one in terms of gates and required ancillas. As our work aims for a proof of principle, we do not compare different schemes in this work. For further research, however, this problem should be faced for an efficient implementation.
4 Results
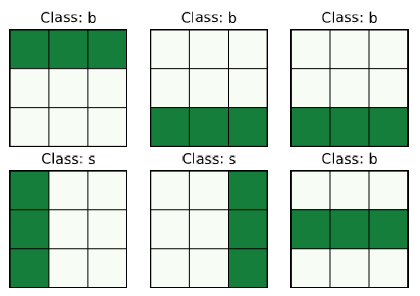
To test, we use a dataset of bars and stripes, that is randomly generated. The samples consist of 3 × 3 pixel figures that contain either a bar or a stripe in one of the rows or columns, respectively. The task is to correctly classify whether a sample contains a bar or a stripe. Examples are shown in Fig. 9. The dataset is split into a training and a test set of 2550 and 450 samples, respectively. The simulations are implemented in Python, using the ProjectQ package [5,24] developed at ETH Zurich to set up the circuits. The actual computation is performed with the QX-Simulator [7] back-end of Quantum Inspire [14], developed at QuTech. The used simulator back-end

can easily be switched with a hardware back-end, which allows an implementation of our algorithm on a real quantum device, assuming that the hardware back-end includes error-correction codes. Besides extracting the theoretical probabilities from density matrices, the Quantum Inspire back-end additionally offers the possibility to simulate realistic experiments. For this, Monte Carlo method is used to simulate actual measurements, based on the theoretical probabilities.
4.1 Learning the model
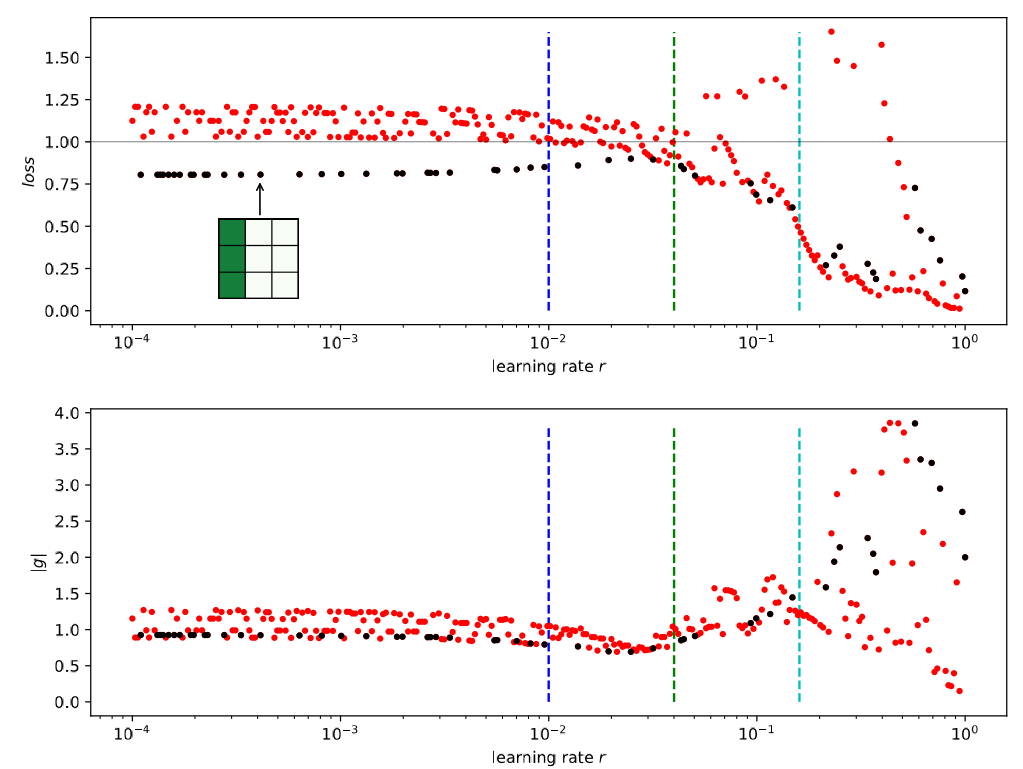
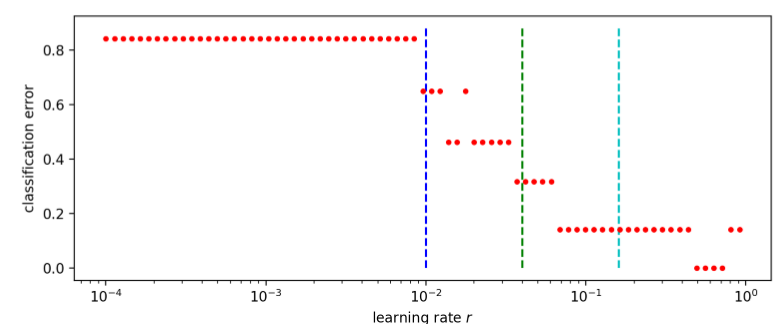
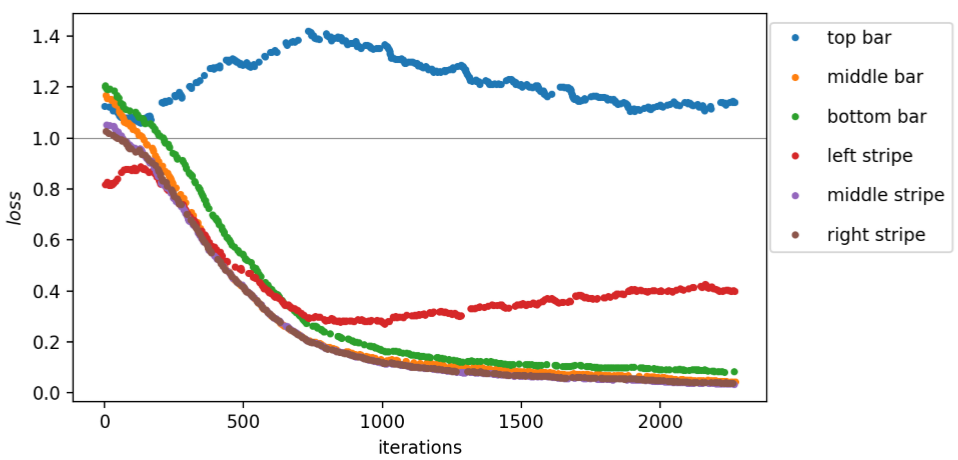
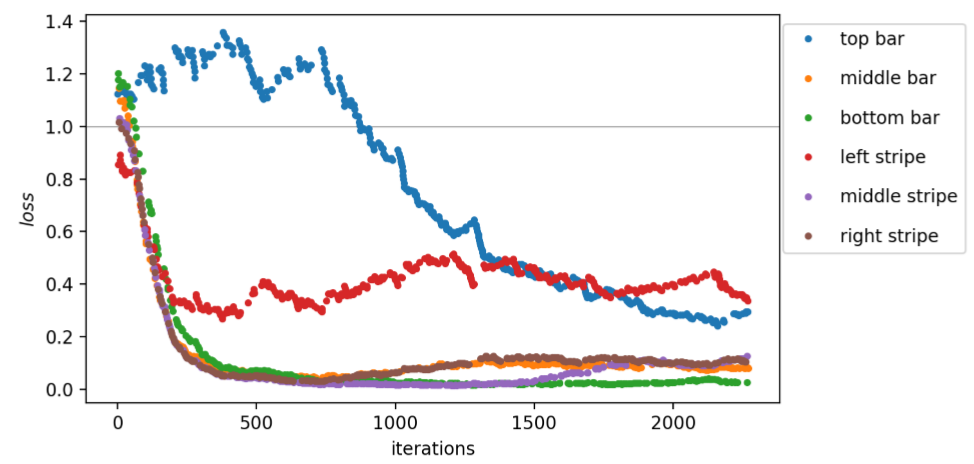
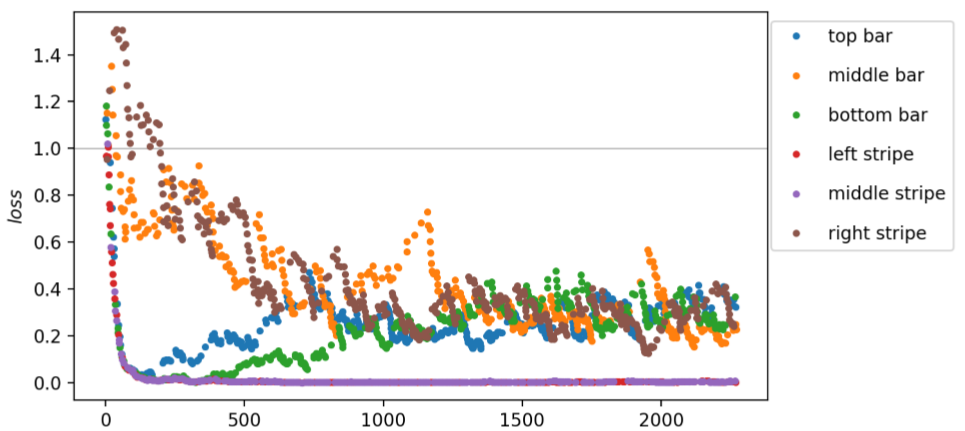
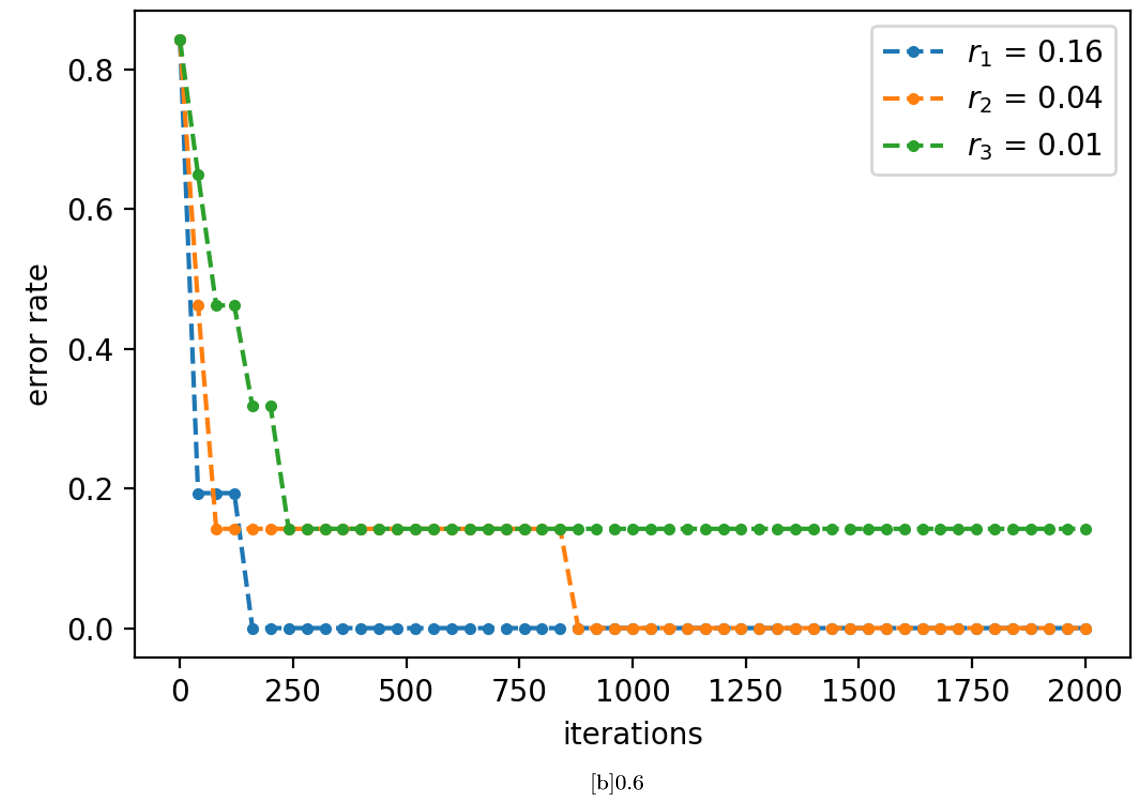
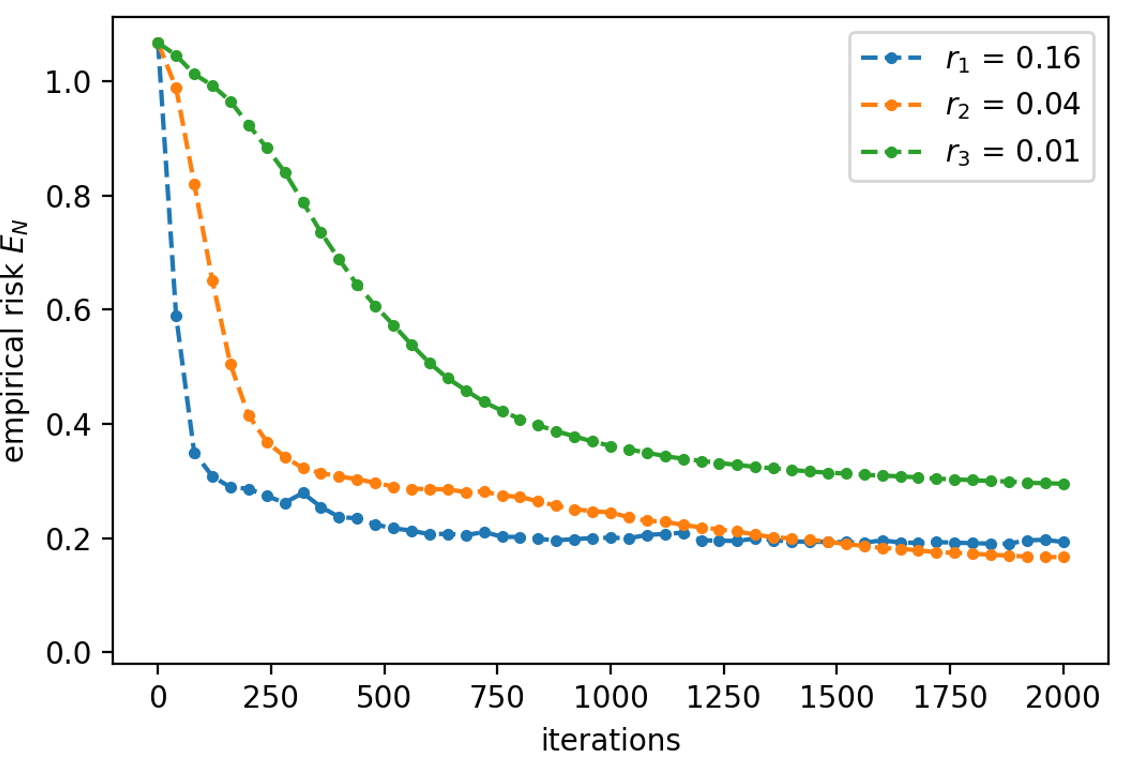
Now, first a suitable learning rate should be estimated for this dataset. The loss and norm of the gradient |∇θloss| are plotted against the learning rate in Fig. 10. To track the evolution of loss for a single sample, the values corresponding to the left stripe are colored in black. For very small learning rates, the parameters are updated by only a tiny amount and the loss of the next sample is close to what it was before. This results in six branches of loss corresponding to all possible input patterns when r is small. With increasing r, the branches merge and the loss decreases except for some outliers. The corresponding classification error at several stages during the test run is estimated by considering the error rate on classifying the six different sample. As shown in Fig. 11, it starts at a constant value of (frac{5}{6}) for small r, drops slowly towards zero starting from a learning rate of around (10^{-2}) and eventually increases again at large r. Based on the test run, we perform the actual training of our variational quantum circuit with three different learning rates r1 = 0.01, r2 = 0.04 and r3 = 0.16. The resulting losses are plotted in Fig. 12, 13 and 14 for r1, r2 and r3, respectively. The colors represent the different input samples presented at a certain iteration. Whereas the branches of loss are relatively smooth for r1, at higher learning rates the loss fluctuates more. Remarkably, both top bar and left stripe have higher losses than the other samples for r1 and r2. In the case of r1, the loss of the top bar stays above 1, meaning that it is always classified incorrectly. The training runs with r2 and r3 yields losses smaller than 1 for all samples, which means that all samples are classified correctly. For the training with r2, the initial and final gate parameters are presented in Table 1. The classification errors as well as the empirical risk EN based on the parameters from all three training runs are compared in Fig. 15. As only six different samples are considered, the classification error decreases stepwise for each further sample that can be classified. The empirical risk is a smoother measure of the learning performance and decreases more continuously. Note that with the definitions in Eq. (3) and (7), (E_{N}=1) corresponds to random guessing and (E_{N}=0) to perfect knowledge. Initially, (E_{N}) is slightly larger than 1 and decreases quickly for r2 and r3, whereas it decreases significantly slower for r1. In the beginning, the empirical risk is smaller the larger the learning rate, however, after
around 1,500 iterations the intermediate rate r2 has the smallest empirical risk. For r3, (E_{N}) seems to settle around 0.21, for r2 and r1 it reaches 0.19 and 0.3, respectively, and seem to further decrease.

[t]0.6
4.2 Dense presentation of data
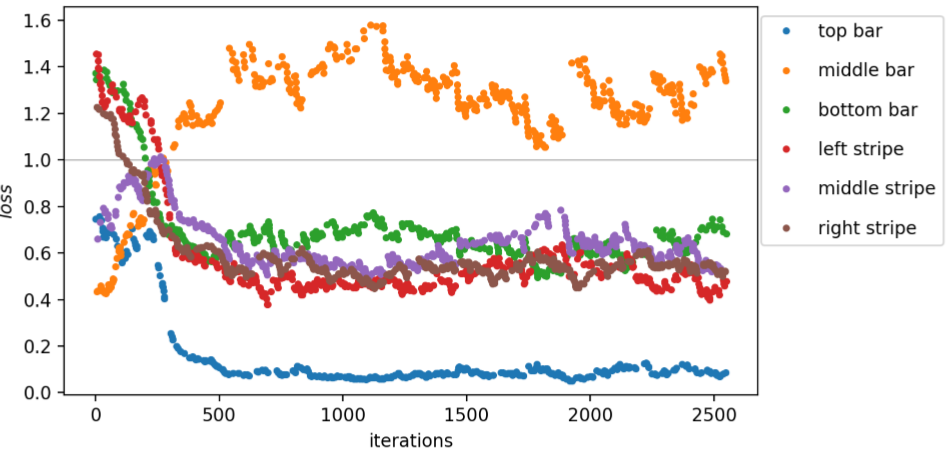
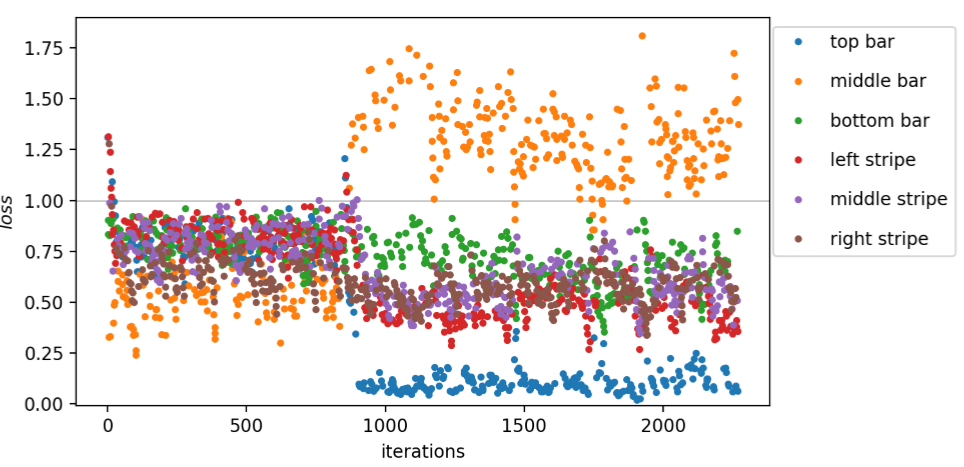
Presenting the bars and stripes data in a more compact form, the loss estimated during training with a learning rate of r3 = 0.16 and a single alternation of an XX– and ZX-layer is shown in Fig. 16. Different colors represent the input samples for which the loss is estimated. Most of the estimated losses lie between 0.4 and 1 and no clearly visible branches can be found. Choosing smaller learning rates r2 = 0.04 and r1 = 0.01 yield loss evolutions as presented in Fig. 17 and 18, respectively. In both cases, the branches can be seen again. For both learning rates, only the middle bar has a loss larger than 1 and cannot be classified correctly. Throughout all three figures, branches are less fluctuating the smaller the r.
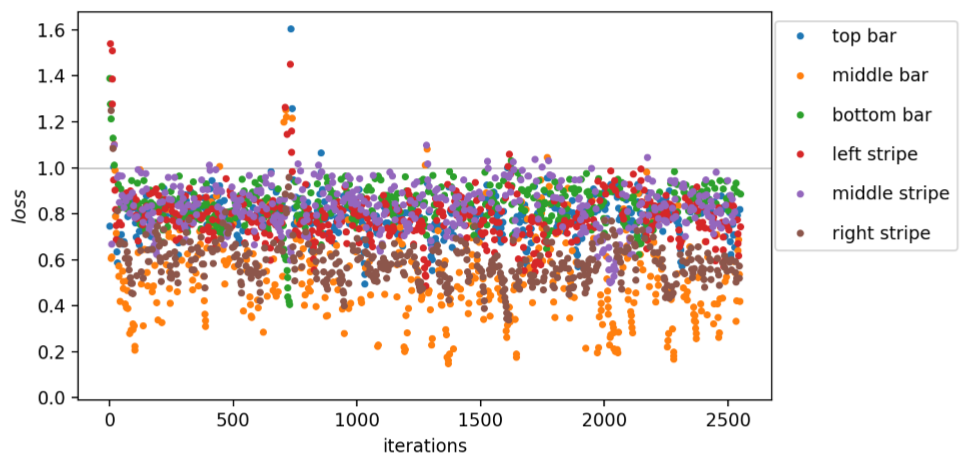
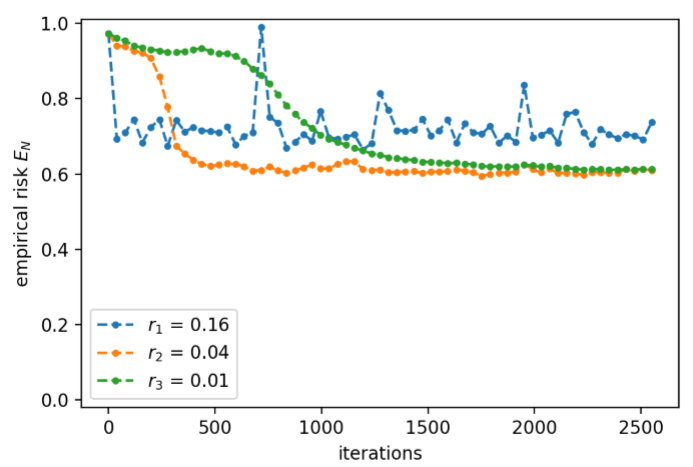
The empirical risks (E_{N}) at different stages during training for the three trainings are displayed in Fig. 19. For r1 and r2 (E_{N}) settles at 0.61, the empirical risk of r3 remains larger and fluctuates approximately around 0.71. As the loss in Fig. 16 fluctuates too much to see distinguishable branches, we investigate whether another alternation of an XX– and ZX-layer improves the performance. Training this model with two alternations and the same learning rate r3 = 0.16, the estimated losses are presented in Fig. 20. For the first 800 iterations, the model with more parameters produces the same structure as in Fig. 16. Thereafter, the samples with middle bars have an increased loss larger than 1, whereas samples with a top bar now have a decreased loss. The remaining samples have losses between 0.4 and 0.8 now.
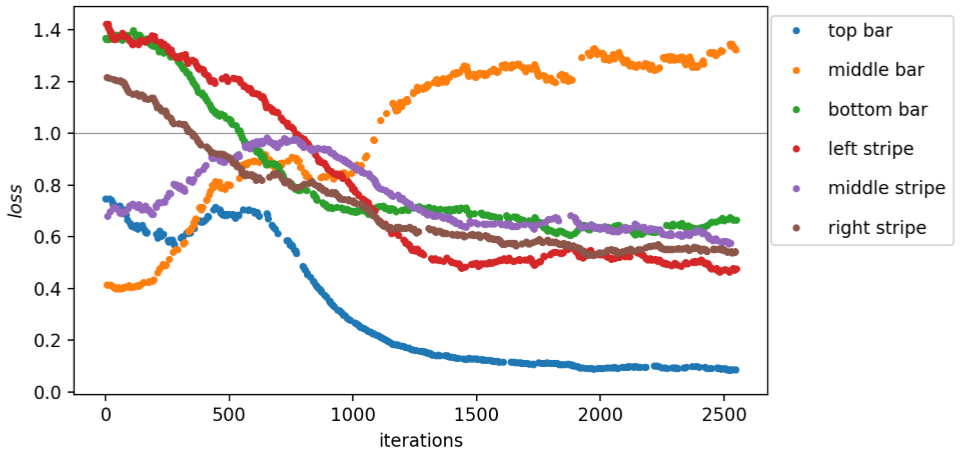
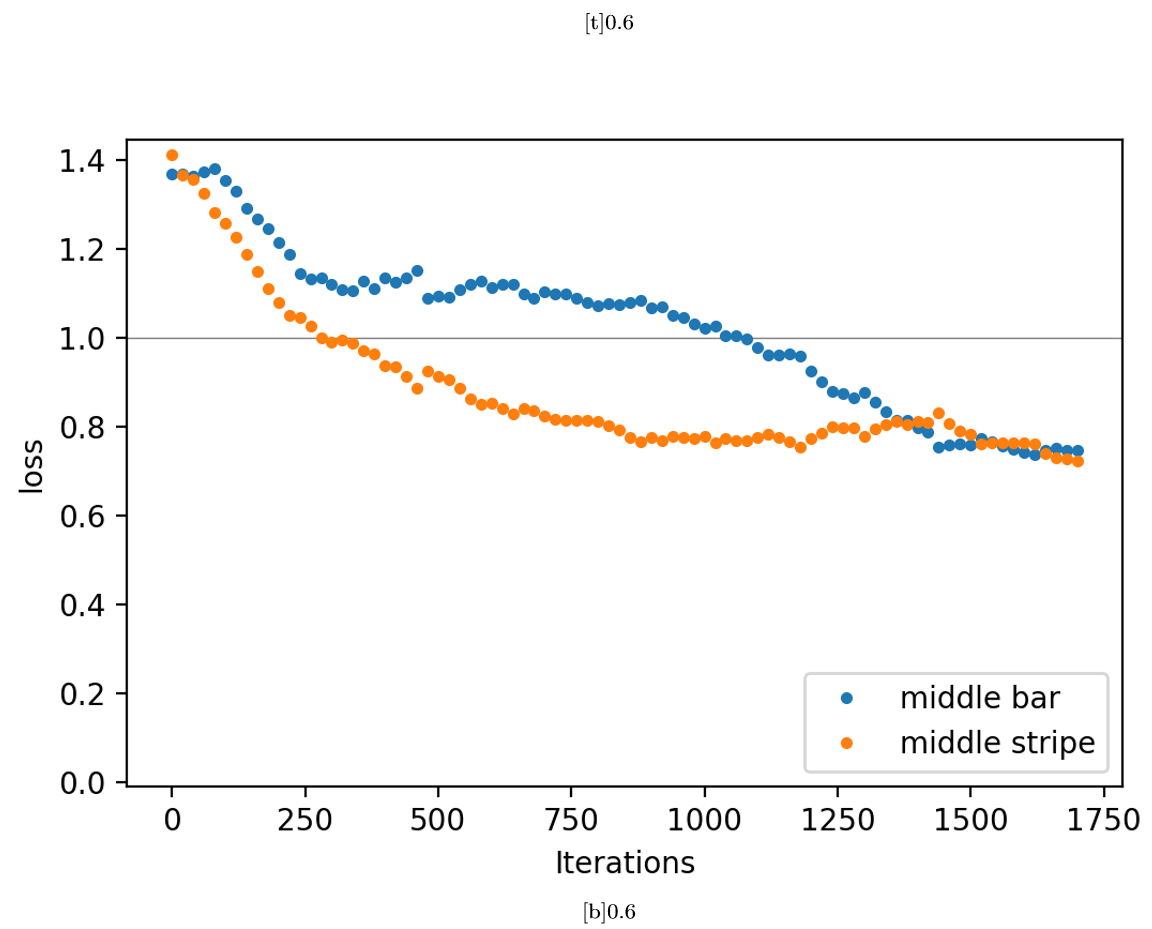
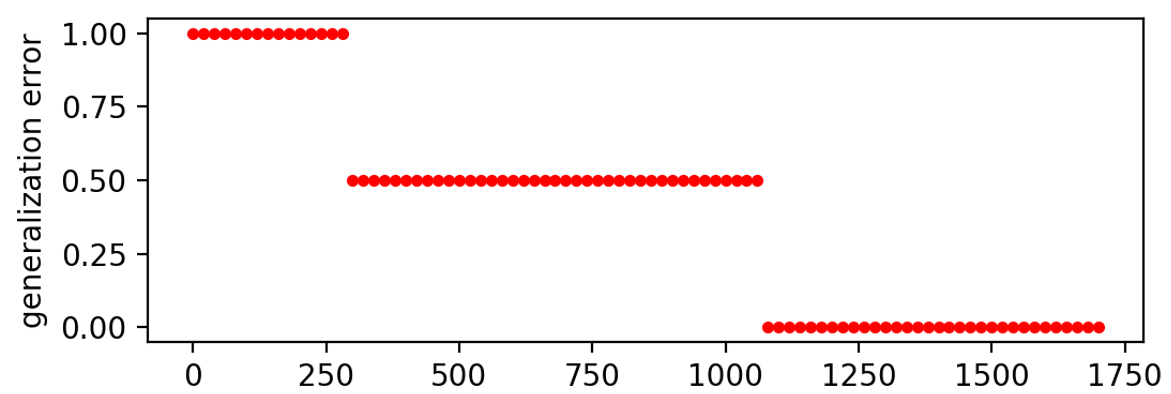
As before, the generalization is tested by training our model without middle bars and stripes. Since the r1 shows the most stable behavior of the three learning rates discussed before, we choose this rate here. The losses estimated during the training are shown in Fig. 21. The four branches corresponding to the samples are clearly visible and overall all have a smaller final loss compared to initially. Moreover, after around 1100 iterations the loss of all branches drops below 1. Presenting both left out samples to the circuit with parameters from taken from different stages of training, the loss as well as the corresponding generalization are presented in Fig. 22. Before training, the losses of both the middle bar and stripe are initially around 1.4 and decrease during training. After around 300 iterations the middle stripe can be classified with a loss smaller than 1 and after around 1100 iterations both losses drop below 1. Accordingly, the generalization error on both samples drops from 1 to 0.5 and eventually to 0.
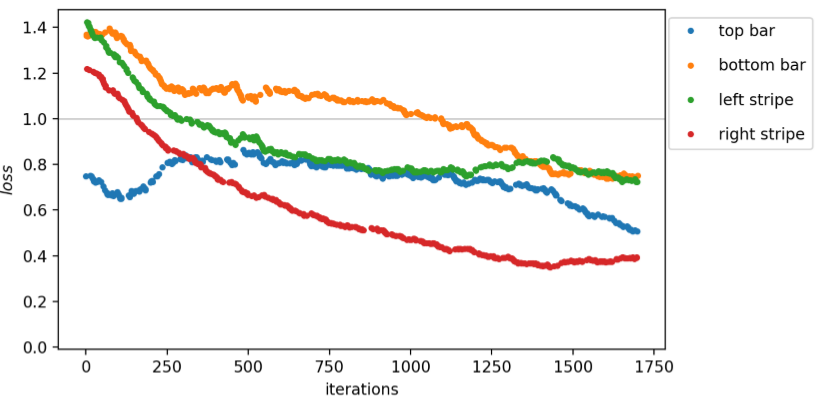
Whereas branches could be seen for all chosen learning rates with normal presentation of data, in the case of more compact presentation of data branches can not be found for r3, but are recovered for r1 and r2. The large fluctuations of the loss and also the empirical risk for r3 can be explained by a too large step size in the parameter space, which leads to instability of training. From this we infer that the learning rate for the dense representation should be chosen smaller than for the trivial presentation of data. Introducing another XX− and ZX-layer leads to a better classification of some of the samples, but in our simulation the middle bar is classified incorrectly after 800 iterations. Therefore, the overall loss remains unaffected, whereas the classification error increases. For a clear comparison between the model with one and two alternations, further analysis is required. However, based on our results, we expect that the overall performance doesn’t improve significantly and we thus do not further investigate in such a comparison. As the estimated losses for all learning rates are mostly smaller than 1, the classification errors are comparable to the trivial presentation of data. However, the empirical risk of r1 and r2 settles at 0.61, which is significantly larger than what we achieve with trivial representation. This means that samples are classified correctly with a smaller probability than with a trivial presentation of data. Thus, the model performs worse with the denser presentation. A possible explanation may be that the gates applied to the quantum register are not the best choice. For instance, generalized Pauli-gates acting on more than two qubits may be more sensitive to correlations in the input data and perform better. However, it is just as likely that the more compact representation itself is a bad choice, because the relevant information contained in the input samples is partially erased in this scheme. An information-theoretical analysis of the model and our datasets may give a better insight here and help to find an efficient scheme to represent bit strings. sectionConclusion In this work we have implemented a variational quantum circuit, which is able to classify small artificially generated datasets with binary labels. The model is based on the work of Farhi and Neven in Ref. [3]. However, we have used a different scheme for gradient estimation, we have presented an explicit decomposition into single-qubit rotations and CNOTs and our code could easily be applied to real quantum devices with only a few adaptions. We have found that the loss function is symmetric under inversion of all input bits, which yields a smooth evolution of the loss during training for datasets containing only a sample and its counterpart. We have considered two such datasets and the model has easily learned to classify the inputs, where the loss converges to zero. When a dataset contains more samples, the loss takes a different value for each possible input sample, which leads to structures we call branches. Training the model with our bars and stripes dataset, the loss of most branches have decreased and a small classification error has been reached.
We have further introduced a different scheme to present data, which focuses on the positions of colored pixels or bits being 1, respectively. This approach requires a quantum register that is logarithmic in the input size, which can be important on near-term quantum devices, where the number of qubits is restricted. Using this presentation, our model has learned to classify bars and stripes, however, in terms of the empirical risk the performance has been worse than for trivial presentation of data. Therefore, the probability to classify data correctly has been smaller for our new scheme. We consider a more efficient representation of data as important for implementations on near-term quantum devices, our scheme should be seen as small step towards this direction.
Quellen und Referenzen:
[1]L´eon Bottou. Stochastic gradient descent tricks. In Neural networks: Tricks of the trade, pages 421–436. Springer, 2012.
[2] Zhao-Yun Chen, Cheng Xue, Si-Ming Chen, and Guo-Ping Guo. Vqnet: Library for a quantum-classical hybrid neural network. arXiv preprint arXiv:1901.09133, 2019.
[3] Edward Farhi and Hartmut Neven. Classification with quantum neural networks on near term processors. arXiv preprint arXiv:1802.06002, 2018.
[4] Richard P Feynman. Quantum mechanical computers. Optics news, 11(2):11–20, 1985.
[5] Thomas Ha¨ner, Damian S Steiger, Krysta Svore, and Matthias Troyer. A software methodology for compiling quantum programs. Quantum Science and Technology, 3(2):020501, 2018.
[6] Vojtech Havlicek, Antonio D Co´rcoles, Kristan Temme, Aram W Harrow, Jerry M Chow, and Jay M Gambetta. Supervised learning with quantum enhanced feature spaces. arXiv preprint arXiv:1804.11326, 2018.
[7] Nader Khammassi, I Ashraf, X Fu, Carmen G Almudever, and Koen Bertels. Qx: A high-performance quantum computer simulation platform. In Des. Autom. Test Eur. Conf. Exhib., 2017, pages 464–469. IEEE, 2017.
[8]Gui-Lu Long and Yang Sun. Efficient scheme for initializing a quantum register with an arbitrary superposed state. Physical Review A, 64(1):014303, 2001.
[9] Jarrod R McClean, Sergio Boixo, Vadim N Smelyanskiy, Ryan Babbush, and Hartmut Neven. Barren plateaus in quantum neural network training landscapes. arXiv preprint arXiv:1803.11173, 2018.
[10] Gr´egoire Montavon, Genevi`eve B Orr, and Klaus-Robert Mu¨ller. Tricks of the trade. 1998.
[11] L O’Driscoll, R Nichols, and PA Knott. A hybrid machine-learning algorithm for designing quantum experiments. arXiv preprint arXiv:1812.03183, 2018.
[12]Alejandro Perdomo-Ortiz, Marcello Benedetti, John Realpe-Go´mez, and Rupak Biswas. Opportunities and challenges for quantum-assisted machine learning in near-term quantum computers. arXiv preprint arXiv:1708.09757, 2017.
[13] John Preskill. Quantum computing in the nisq era and beyond. Quantum, 2:79, 2018.
[14] QuTech. Quantum Inspire Home, 2018.
[15] Rau´l Rojas. Neural networks: a systematic introduction. Springer Science & Business Media, 2013.
[16] Jonathan Romero, Ryan Babbush, Jarrod R McClean, Cornelius Hempel, Peter J Love, and Ala´n Aspuru-Guzik. Strategies for quantum computing molecular energies using the unitary coupled cluster ansatz. Quantum Science and Technology, 4(1):014008, 2018.
[17] Maria Schuld, Ville Bergholm, Christian Gogolin, Josh Izaac, and Nathan Killoran. Evaluating analytic gradients on quantum hardware. arXiv preprint arXiv:1811.11184, 2018.
[18] Maria Schuld, Alex Bocharov, Krysta Svore, and Nathan Wiebe. Circuit-centric quantum classifiers. arXiv preprint arXiv:1804.00633, 2018.
[19] Maria Schuld and Nathan Killoran. Quantum machine learning in feature hilbert spaces. Physical Review Letters, 122(4):040504, 2019.
[20]Maria Schuld, Ilya Sinayskiy, and Francesco Petruccione. An introduction to quantum machine learning. Contemporary Physics, 56(2):172–185, 2015.
[21] Peter W Shor. Algorithms for quantum computation: Discrete logarithms and factoring. In Proceedings 35th annual symposium on foundations of computer science, pages 124–134. IEEE, 1994.
[22] Leslie N Smith. Cyclical learning rates for training neural networks. In Applications of Computer Vision (WACV), 2017 IEEE Winter Conference on, pages 464–472. IEEE, 2017.
[23] Andrei N Soklakov and Ru¨diger Schack. Efficient state preparation for a register of quantum bits. Physical Review A, 73(1):012307, 2006.
[24] Damian S Steiger, Thomas H¨aner, and Matthias Troyer. Projectq: an open source software framework for quantum computing. Quantum, 2:49, 2018.
[25]Pavel Surmenok. Estimating an optimal learning rate for a deep neural network, Nov 2017.
[26] Dan Ventura and Tony Martinez. Initializing the amplitude distribution of a quantum state. Foundations of Physics Letters, 12(6):547–559, 1999.
[27] Javier Gil Vidal and Dirk Oliver Theis. Input redundancy for parameterized quantum circuits. arXiv preprint arXiv:1901.11434, 2019.
[28] M Mitchell Waldrop. The chips are down for moores law. Nature News, 530(7589):144, 2016.
[29] D Zhu, NM Linke, M Benedetti, KA Landsman, NH Nguyen, CH Alderete, A Perdomo-Ortiz, N Korda, A Garfoot, C Brecque, et al. Training of quantum circuits on a hybrid quantum computer. arXiv preprint arXiv:1812.08862, 2018.


Um einen Kommentar zu hinterlassen müssen sie Autor sein, oder mit Ihrem LinkedIn Account eingeloggt sein.